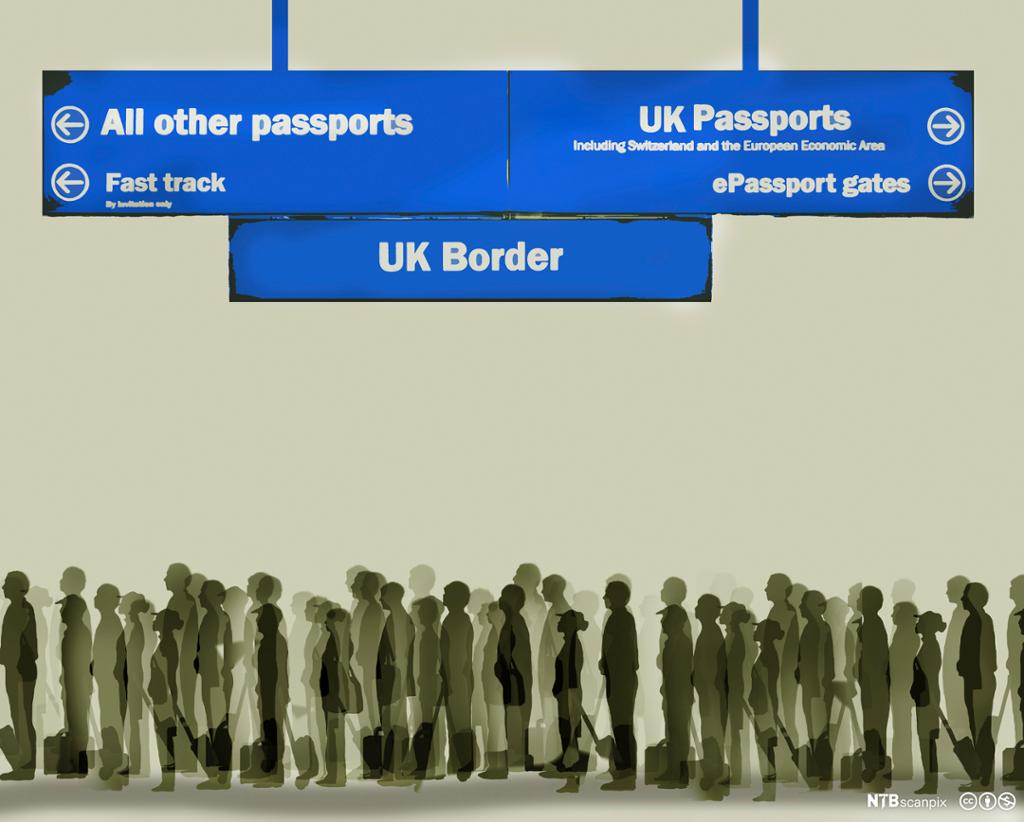
UK Immigration


People have been coming to settle in Britain for several hundred years, either to escape persecution or to try to make a better life for themselves and their families. Many Irish came in the 19th Century after the Irish potato famine. Jewish refugees, who came to Britain at the end of the 19th Century and in the 1930s, were followed by other European refugees after 1945.
Many of the former British colonies became independent after World War II, and people from these colonies were invited to emigrate to Britain, because Britain needed workers for its expanding industries. Large numbers came in the 1950s and1960s, especially from the Caribbean, India and Pakistan.
There are large groups from the United States and Canada as well as Australians, Chinese, Greek and Turkish Cypriots, Italians and Spaniards. In recent decades, many people from Latin America, Indo-China, some countries in Africa and Sri Lanka have arrived. Many of these immigrants have settled in the large urban areas of the South-East, the Midlands and the North. London in particular has large concentrations of immigrants, with ethnic groups accounting for over a third of the population in some areas.
As an introduction to the current situation, you might want to watch this video (4 mins.) from 2016 about the impact of immigration on the UK: https://www.youtube.com/watch?v=7oOmA09unRM
According to the UK Office for National Statistics immigration continues to add to the population of the UK. In other words, in 2018 more people moved to the UK (immigrants) than moved out of the UK (emigrants). Jay Lindop, the Director of the Centre for International Migration writes that “migration continues to add to the population and has remained fairly stable since its peak in 2016, with around 280,000 more people coming to the UK than leaving in 2018”.
The following points characterize UK migration in 2018:
There are different patterns for EU and non-EU migration
Since the EU «Brexit» Referendum in June 2016, the number of immigrants from the EU has fallen to a level last seen in 2009. Actually, in 2018 more citizens from Central and Eastern European countries, for example Poland – left the UK than arrived. This pattern differs from the rest of the EU where more people are still arriving than leaving.
In contrast, the number of non-EU immigrants was the highest since 2004. There has been a gradual increase in immigration of non-EU citizens over the past five years for both work and study, particularly from India and China.Fewer people are coming to the UK for work
Immigration to the UK for work has fallen to its lowest level since 2014.
More people are coming to the UK to study
The overall number of people arriving in the UK to study has increased, with non-EU student immigration at its highest level since 2011.

This chart shows the population of England and Wales by ethnicity in percent. It is based on the results of the 2011 Census.

Discussion questions
- Before you take a closer look at these statistics of different ethnic groups in England and Wales, write down some thoughts about what your own expectations were. What ethnic groups did you think would be the largest? And can you explain why you had these specific expectations or what might have influenced you?
- Excluding (like the chart does) the category “White British”, can you use the chart to list the top five largest ethnic groups in England and Wales?
- A census, or a count of the population, takes place every ten years in England. This means that the next census will take place in March 2021. Do you think that these statistics might have changed significantly by then?